Pages

Showing posts with label Science. Show all posts

Tuesday, 5 November 2019

Science - Climate Change and the Future

Aim; To look at the different ways we can prevent climate change in the future.


What places will be effected?
Pacific Island, New Zealand (Different places near the sea)

What else do we need to think about?
Where you live, Where to build houses,


What other places around NZ will be affected?
Auckland - Har bour, Lion rock, Nelson, Bay of islands and more

What does this do to our drinking water?
Salt water, Sea level rise

What are the main concerns?
  1.  One of the main concerns are where to build your houses as the sea level rise can floud those houses  
  2.  The second one is that we will stat to get salt water into our drinking system.

What can we do?
  1.  Build our houses away from the sea
  2.    STOP plastic

What is the one, silver bullet solution?
There is no silver bullet 


What is the mix of things we need to start doing?
  1.   Renewable 
  2.   Solar heating
  3.  Transport
What are 3 others you can think of?
  1.  Walk
  2.   Cycle
  3. recycling
Activities:

Carbon Footprint

Carbon Footprint explained

Dwelling
Water
Recreation
Heating and cooling
Electricity
Transportation
Food
Waste
Air Travel
Consumption

Colour 1: for actions they are already doing 
Colour 2: for actions that they pledge to undertake in the future

Ecological Handprint The Ecological handprint builds on the concepts from the Carbon Footprint. We will look at the positive actions of:

  1. Transportation
  2. Community
  3. Consumption
  4. Water
  5. Food
  6. Home
  7. Waste


1 Colour: For each action you are already doing 
2 Colour: For each action you would like to do in the future

    Tuesday, 29 October 2019

    Science Decompistion


    Aim: To learn about the rate that different materials decompose. 


    Image result for test tube rack


    Hypothesis: I think that...... The Banana is going to rot the fastest

    Materials:

    1.   Bread
    2.   Water
    3.   Test Tubes
    4.   Banana
    5.   Cardboard
    6.   Styrophone
    7.   Test tube tack
    Steps:
    1.   Add the bread, styrophone, banana and cardboard into a test tube each.
    2.   Add water to the test tube that had bread
    3. Put little lids on them
    4.   Put them all in the test tube rack
    5.   Let it sit for about 3 weeks
    6.   See what had happened to it
    Image:


    Findings:


    TODAY
    Colour
    Change
    Observations
    Banana
    YellowLittle BrownThe banana started to go a little disgusting
    Paper
    BrownBrownThe paper was just the same
    Styrophone cup
    WhiteWhiteIt stayed the same
    Bread
    CreamcreamThe bread started getting hard

    3 weeks
    Colour
    Change
    Observations
    Banana
    GreenMouldyThe banana had become completely mouldy
    Paper
    BrownBrownThe paper stayed the same
    Styrophone cup
    WhitewhiteThe styrophone had mold around the edges
    Bread
    Green/CreammouldyWas watery

    5 weeks
    Colour
    Change
    Observations
    Banana
    GreenGreenThe banana has stated to become hairy
    Paper
    BrownBrownIts stayed the same
    Styrophone cup
    WhiteWhiteI has formed more mold in the tube
    Bread
    CreamBit of moldSoggy


    Conclusion:

    This experiment was very disgusting. I didn't like it at all. The was a complete difference in 3 weeks. But this did turn out how it was supposed to and my guess was correct that the banana was going to rot the fastest There is also a very  big difference from 3 weeks to 5 weeks.

    Friday, 25 October 2019

    Science Week 2: Pizza Ovens

    Renewable Energy
    Aim: To make a solar powered oven

    Equipment:

    1. Sellotape
    2. Scissors
    3. Pizza box
    4. Straw
    5. Marshmallow
    6. Biscuit
    7. Glad wrap
    8. Tin foil
    9. Black plastic
    10. Ruler
    11. Vivid marker
    12. Newspaper
    13. Plastic Plate
    Steps:
    • Cut out the flap on the lid of the pizza box so that it is 5 cm around the edge
    • Sellotape some tinfoil on the inside of the flap
    • Sellotape some glad-wrap so that the whole you have cut on the pizza box lid is covered over with glad-wrap
    • Put a piece of black plastic on the bottom of the inside of the box. 
    • Make a paper square that fits inside the pizza box and lays around the edge
    • Put a marshmallow on top of a chocolate biscuit, place it on a plastic plate and put it in the solar oven
    • Put it in the sun to cook.
    Conclusion:

    Our experiment didn't work exactly. I think it should be in a place that the sun comes out more often and is close to our "OVENS". The smores were DELICIOUS.

    Science Week 1 - Wind Turbine


    Measuring weather.


    Aim: To test the wind to see how you would test the wind

    Definitions:

    1. Anemometer:
    2. Beaufort wind scale:

    Anemometer

    MATERIALS

    1. 2x sticks  
    2. Cello Tape
    3. Pencil  
    4.   4x cups
    5. Pin
    6. Sticky note
    7. Scissors

    STEP

    1. Collect materials
    2. Tape the 2 sticks together to form a cross  
    3.   tape the sticks onto the cups
    4.   plug the pin through the tape
    5.   stick the pin into the rubber of the pencil
    6. then write your names on a sticky note and stick it onto your Anemometer

    Group Investigation.

    Groups size: 5 
    Roles:

    • Timekeeper ( watch)
    • Counter
    • Recorder ( Chromebook or refill )
    • Anemometer Manager ( Anemometer)
    • Wind Manager

    Instructions:
    • Go to the measuring place and set up your wind gauge.
    • Make sure everyone in your group is ready to start their roles.
    • Record how many times it spins and record it in the table below.
    • Count the number of spins in 15 seconds.
    • Record it on your chart.

    FINDINGS


    Place name on school grounds                                    Number of Spins in 15 seconds
    1.Field20
    2.Old J Block site15
    3.Grass hill in quad10
    4.Tennis Court gate3


    CONCLUSION:

    This week in science we have been focusing on a wind power and how reporters tell how the weather is going to be. We had to be in a group of 5, in my group I was with Amanda, Latoiya, Bianca and Keghan.  We have made a wind power source that we are going to test in the areas above and with that we will be recording the number of spins. We have been focusing on the graph below on what the we found. There is a bit of maths that is in there but I had a little help, (Not by Cheating). This week with science was more complicated tan I had expected. I always love challenging myself aswell.


    Wind


    Beaufort
    Force
    Wind Speed
    (KPH)
    Spins
    Indicators
    Terms Used in NWS Forecasts
    0
    0-2
    0
    Calm; smoke rises vertically.
    Calm
    1
    2-5
    10
    Shown by direction of wind smoke drift, but not by wind vanes.
    Light
    2
    6-12
    40
    Wind felt on face, leaves rustle; ordinary vanes moved by wind.
    Light
    3
    13-20
    80 
    Leaves and small twigs in constant motion; wind extends light flag.
    Gentle
    4
    21-29
    130
    Raises dust and loose paper; small branches are moved.
    Moderate
    5
    30-39
    190
    Small trees in leaf begin to sway; crested wavelets form on inland waters.
    Fresh
    6
    40-50
    250
    Large branches in motion; whistling heard in telephone wires; umbrellas used with difficulty.
    Strong
    7
    51-61
    320
    Whole trees in motion; inconvenience felt walking against the wind.
    Strong
    8
    62-74
    390
    Breaks twigs off trees; generally impedes progress.
    Gale
    9
    75-87
    470
    Slight structural damage.
    Gale
    10
    88-101
    550
    Seldom experienced inland; trees uprooted; considerable structural damage occurs.
    Whole gale
    11
    102-116
    640
    Very rarely experienced inland; accompanied by widespread damage.
    Whole gale
    12
    117 or more
    730+
    Very rarely experienced; accompanied by widespread damage.
    Hurricane

    Based on your findings what was the Wind Speed and the Beaufort Wind Force for each area.


    Spins per minute
    Wind speed ( kph)
    Beaufort Scale
    Field
    166-122
    Old J Block site
    102-51
    Grass hill
    50-20
    Tennis Court Gate
    30-20


    WHICH IS THE WINDEST AREA AND WHY?
    WHICH IS THE CALMEST AREA AND WHY?
    WHERE IS THE BEST PLACE ON LAND TO BUILD A WINDMILL?


    1. The field is the windiest as the cars come past and make a lot of wind plus its a big space.
    2. The Tennis court is the calmest as its all fenced off and there would be very little wind.
    3. The best place to build a windmill would have to be the old J block site because people won't be over there most of the time and it's also out of the way of the children

    Friday, 27 September 2019

    Saftety equitment in a science lab

    Today we have been learning about the equipment in the lab and some of the safety rules as well. 

     Aim: To get across what the rules are in the science lab
    Top five Safety rules in a Science lab:

    1.  NO Running
    2. Bags at the back of the classroom or under your desk
    3. If you break a glass product tell a teacher right away and clean up the mess
    4. Listen carefully to instructions
    5. Make sure if there is any water involved, and any of it spills on the floor clean it up.
    6. NO Food or drink
    7. Only a murmur voice as someone could be trying to do there experiment and someone starts to yell which will put them of and may spill something
    8.  Be careful of your surroundings
    9. Have your hair tied up
    10. Never inhale any chemicals
    Safety equipment:

    Beaker
    Test Tubes
    Spatula
    Tongs
    Funnel
    Conical Flask
    Measuring cylinder
    Flask


    Friday, 13 September 2019

    Science - Reflection


    AIM: TO LEARN ABOUT WATER ON EARTH.

    Definition:


    Scientific words:

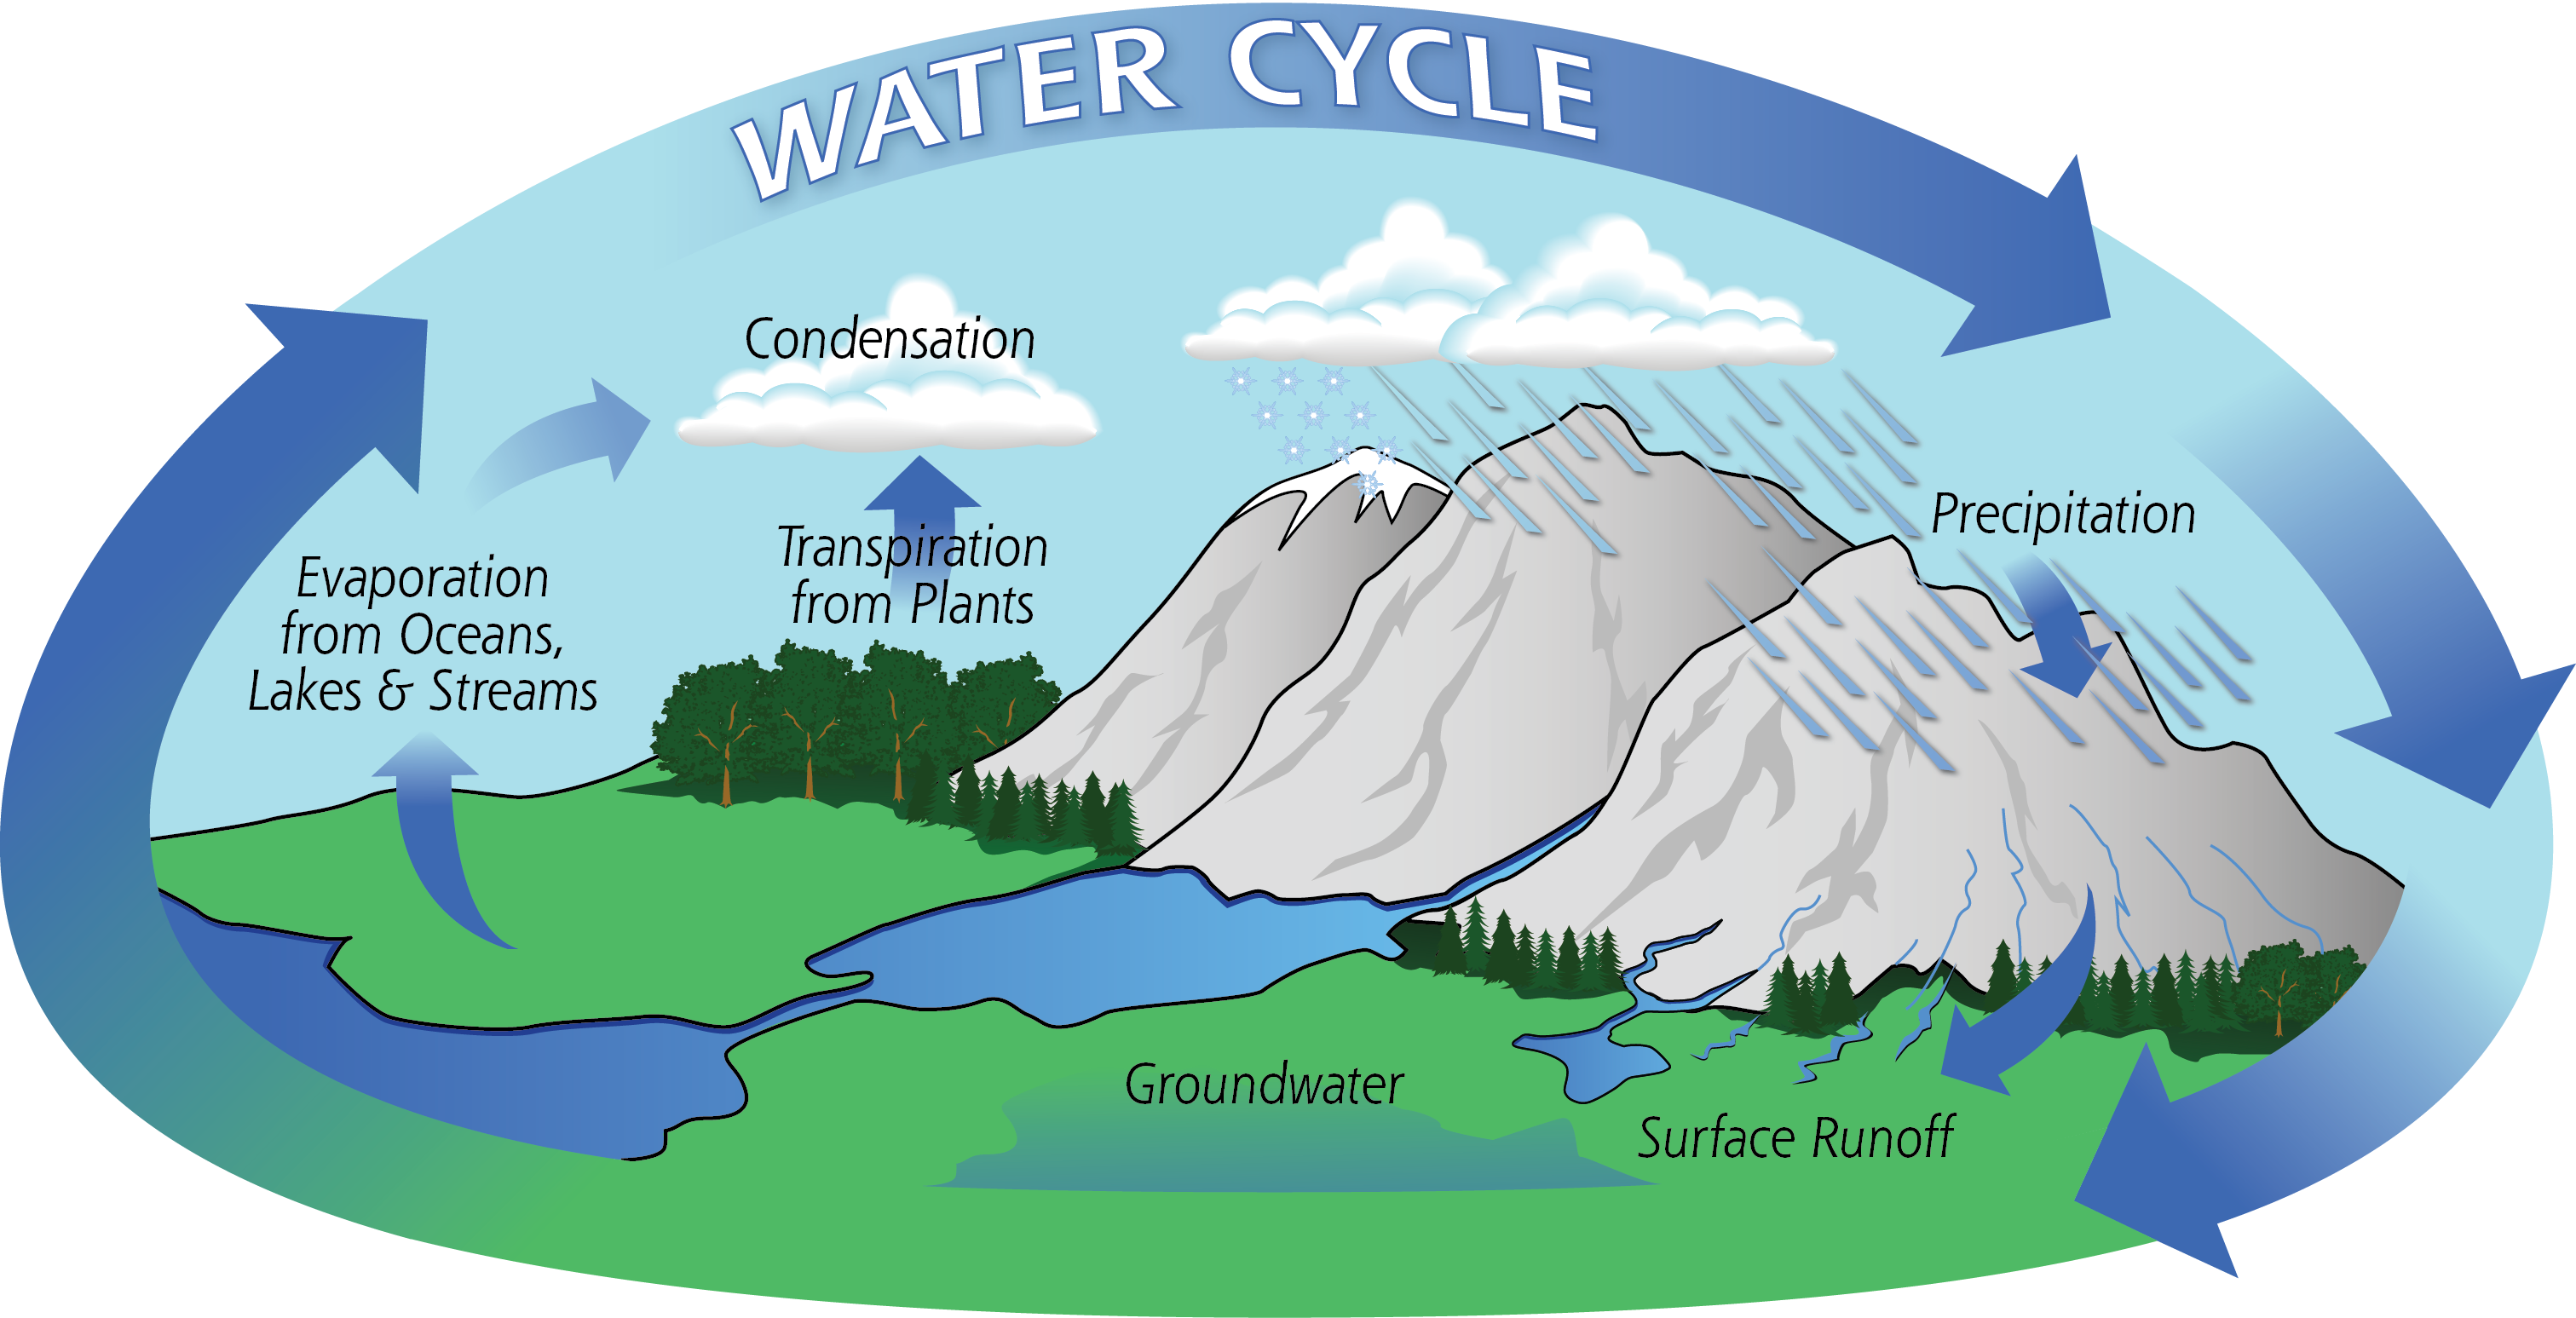
    • Evaporation. When water is heated by radiant energy it turns into water vapor.
    • Transpiration. Evaporation from plants.
    • Condensation. When water vapor cools, molecules join together and form clouds.
    • Precipitation. When clouds get heavy the waters falls as rain, sleet, hail, or snow.
    • Acidification: the action or process of making or becoming acidic.

    THE WATER CYCLE SONG

    Image result for the water cycle

    THE WATER CYCLE EXPERIMENT

    Bag 1: Normal Water cycle
    Bag 2: Water cycle with CO2 added: like Oceans in climate change
    Bag 3: Water cycle with ice added: like Antarctica in climate change

    Material:

    1.  Vivid
    2.  2x Bags
    3. 1/2 Water 
    4.  1 tbsp of baking soda

    Steps:

    1.  Draw your water cycle
    2.  Carefully add the water
    3.  If your doing the acid one, add 1 tbsp of baking soda and litmus paper at the top
    4.  Add some food colouring
    5. Wait at least 2 - 3 wks

    Two Images:


    Findings:


    The Water Cycle: Bag 1
    CO2 Water Cycle: Bag 2
    Acid
    Desert Water Cycle
    Bag 3
    Does it cycle?
    23
    Amount of Water
    23
    Acidity
    13

    Key: Water and acidity amount: 1 = none 
    2 = small 
    3 = large 


    Conclusion:


    The normal water cycle had less condensation than the other. The normal bag didn't have any Baking soda involved

    The water cycle with the acid, had changed the colour of the litmus paper to red after it started out blue.


    Tuesday, 10 September 2019

    Science (Solar Pannels)

    Aim: To find out what colour attracts the suns heat.

    Hypothesis:

    I think that the colour is going to be silver/Tin foil.

    Materials:

    1.  1x Tin foil cup
    2.  1x Clear cup
    3.  1x Black plastic bag
    4.  1x Small black bag
    5.  1x Heat lamp
    6. 1x White paper
    7. 1x Thermometer
    8. 1x Tin Foil 
    9. 1x Plastic cup

    Steps

    1.   Collect the equipment
    2.  Set it up, Put the white, tin foil and the black bag on the table.
    3. Put with clear cup on the black bag in the middle
    4. Put the little black bag over it
    5. Put the white cup in the middle of the white paper
    6. Put the tin foil paper in the middle of the tin foil
    7.  Plug in the heat lamp
    8.  Pour the water
    9.   Wait 15 minutes
    10. Record your findings

    Findings:


    Time 
    Cup 1
    White
    Cup 2
    Black
    Cup 3
    Tinfoil
    0
    16.c16.c16.c
    15
    20.c25.c19.c
    30
    20.c35.c20.c
    45
    20.c30.c20.c

    Conclusion


    This is a photo of all of the cups. Throughout this the black one spilled as we let the thermometer. 
    The highest was the black one even though it was on the side. 

    This was amazing 


    Friday, 6 September 2019

    Science - Climate Chaos

    For Science we have been learning about the water cycle. We have been having a look at different types of changes. So with the changes we used litmus paper which should turn red. With the other bag it will possibly just have condensation.

    This is a doc that I used to write up my experiment. Have a look...
    Climate Chaos
    Written by: 

    Title

    Litmus paper water cycle
    Water Cycle

    Experiment 1
    Experiment 2

    Purpose

    To see what happens with the Litmus paper
    To see what happens throughout the condensation

    Materials

    • 1x Zip
    • 1x Vivid
    • 2x Strips of double sided tape
    • Half a cup of water
    • 2x drops of food colouring
    • 1x Pair of scissors
    • 1x teaspoon of baking soda
    • 1x strip of Litmus paper
    • 1x Zip lock bag
    • 1x Vivid (Colour of your choice)
    • 2x stripes of double sided tape
    • Half a cup of water
    • 2x drops of blue food colouring
    • 1x pair of Scissors

    Steps

    Step one:
    You need to get a long zip lock bag and 1 vivid
    Step two:
    Carefully cut 2 strips of double sided tape about 4 cm long
    Step three
    You need to draw out a water cycle on the bag. Don’t poke any holes in there
    Step four:
    Carefully pour half a cup of water in the bag
    Step five:
    Add 1 teaspoon of baking soda.
    Step six:
    Add 2 drops of blue food colouring (Don't get any on your clothes or hands)
    Step seven:
    Close the bag
    Step eight:
    Hang it up on a window where sunlight comes through.
    Step one:
    You need to get a long zip lock bag and 1 vivid
    Step two:
    Carefully cut 2 strips of double sided tape about 4 cm long
    Step three
    You need to draw out a water cycle on the bag. Don’t poke any holes in there
    Step four:
    Carefully pour half a cup of water in the bag
    Step five:
    Add 2 drops of blue food colouring (Don't get any on your clothes or hands)
    Step six:
    Close the bag
    Step seven:
    Hang it up on a window where sunlight comes through

    Conclusion

    What I think the outcome is:
    I think that the outcome is that the litmus paper will turn a different colour
    What I think the outcome is:
    I think that the outcome is that the bag will have condensation in the bag.

    What would your outcome be if you had this experiment?

    Findings:


    The Water Cycle: Bag 1
    CO2 Water Cycle: Bag 2
    Acid
    Desert Water Cycle
    Bag 3
    Does it cycle?
    23
    Amount of Water
    23
    Acidity
    13


    1.  This one has not got the litmus paper 
    2. And the cycle is a bit different to the other 
    Second Bag
    1. There was litmus paper that had changed colour 
    2. This bag had more condinsation from the other